
Are you considering dropping an insurance plan? Before taking such a big step, you are probably concerned about the potential impact that this decision could have on your patients and practice revenue.
Be sure to take into account the following when determining whether to stay in-network with a particular insurance plan:
- Number of patient attached to the plan
- Number of claims processed for the plan over a date range
- Claim processing time and payout amounts
You can easily use Dentrix reports to help you gather and analyze this information.
Number of Patients Attached
Finding out how many patient accounts the plan is attached to is fairly simple. In past blog posts, we’ve talked about finding this number by printing the Insurance Carrier List or searching the plan using eDex.
Numbers of Claims Processed
You might have a thousand patients with the plan on file, but that doesn’t mean that all of those patients are actively being seen or processing claims. The Insurance Transaction Analysis report is a great report to show how a plan is being utilized.
To run the report, from the Office Manager, select the Analysis menu and then click Dentrix Reports. In the Reports column, double-click Insurance Transaction Analysis to open the report’s options.
Within the report options, choose the following:
- In the Select Date for Payments section, choose a date range (for example, choose Previous Year from the menu, or select a specific range of dates).
- You can choose to view By Claim Sent Date, Received Date, or both. To best match the Payment Summary report (which is discussed later on), select Received Date.
- Under Select Insurance Plan, select the alphabetical range that includes the insurance plan(s) you want to include in the report.
- Do not select either the Itemize Claims or Include Claim Transactions options to keep the report simple.
- Select all of the Claim Rendering Providers and Billing Types.
![]()
After selecting OK, the report will appear with today’s date in the queue. Select it from the queue and the final report will appear in the Preview panel.
![]()
To help you interpret the information on this report, please review the article titled, Evaluating which PPO Plans Work Best for Your Practice in Dentrix Magazine.
Consider running and previewing the report again but changing some of the options for comparison. For example, view claims by their Sent Date and the difference between of the # Sent and # Rec’d totals – those claims were still outstanding after the end date of the report. Or select the options Itemize Claims and/or Include Claim Transactions to add additional detail about the patients and types of procedures that were processed on these claims (though be prepared as each of these options might significantly increase the length of the report!).
Processing Time and Rate of Payout
Now that you know the volume of business that this insurance plan brings for your practice, use the Insurance Payment Summary report to look at how the plan compares with speed of payment and payout rates.
Like the Insurance Transaction Analysis report that we just reviewed, double-click the Insurance Payment Summary report in Dentrix Reports.
When setting the options for this report:
- Do not check the Include only Insurance Plans with amount paid over, Exclude Claims that are Partially Paid, or Exclude Secondary Insurance options. That way the report will include all plans, allowing comparison between the two reports.
- Use the same date range that you selected for the previous report to make comparison between the two easy.
- Leave the alphabetical range of insurance carriers to include all carriers to allow the payment rate statistics to consider and compare across all of your plans.
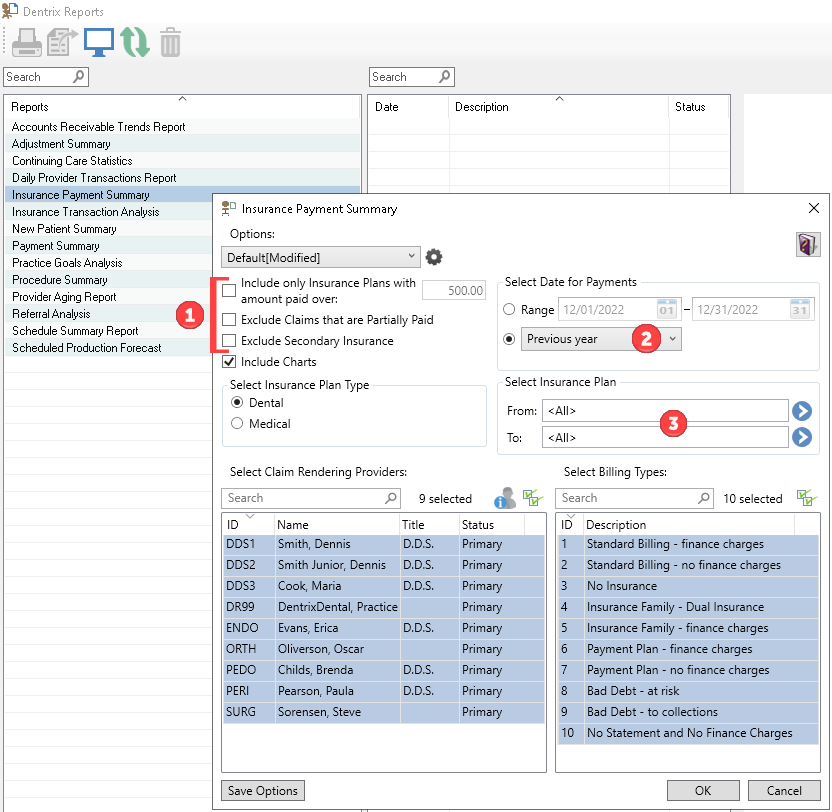
Click OK and preview the report.
This report shows you how many claims were paid within the time frame, with the amounts billed, paid, and estimated. It also shows the minimum, maximum, and average number of days it took to receive those payments.
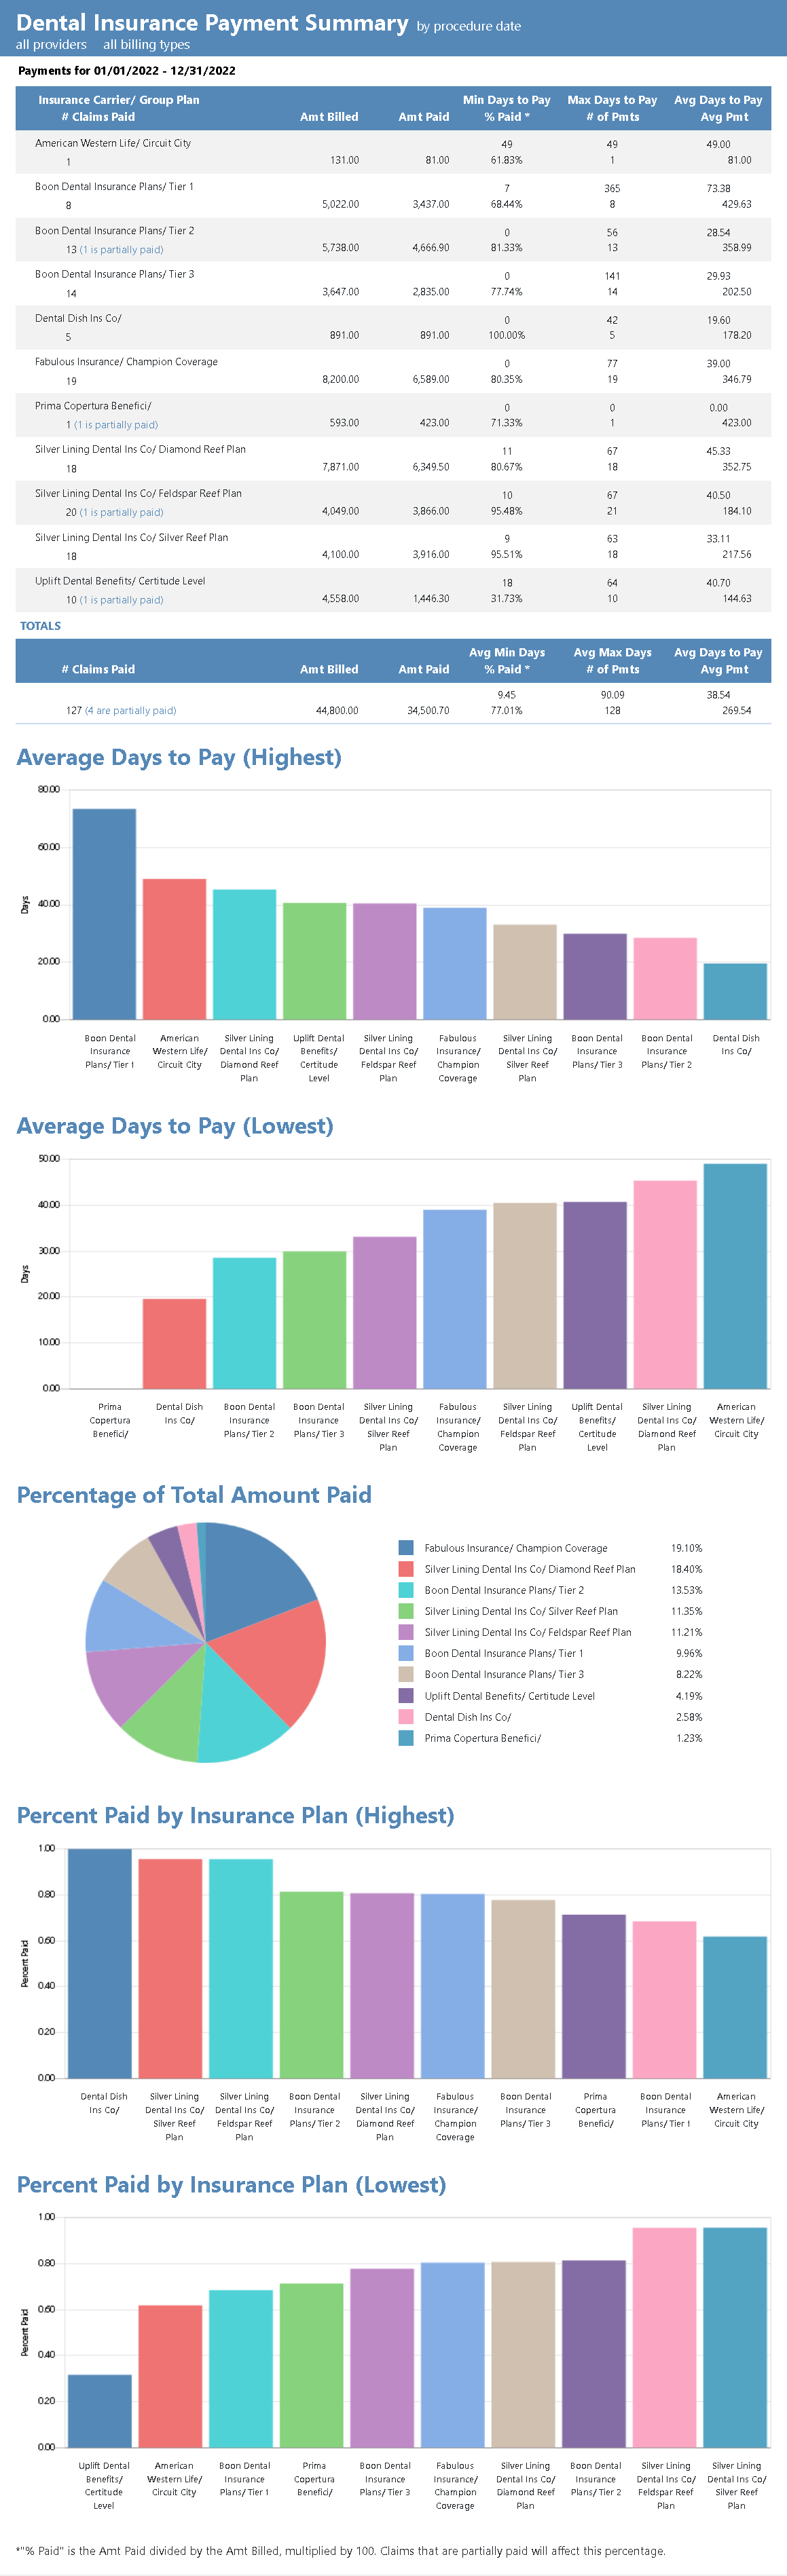
The graphs at the end of the report can be especially informative. Bar graphs depict the plans that took the most and least average days to pay, and which plans paid the most or least by percentage. A pie graph breaking down the total payment received from each plan.
Be sure to take a look the article titled, Evaluating which PPO Plans Work Best for Your Practice in Dentrix Magazine for more help interpreting the information found on this report.
Decision Time
Now that you are equipped with an understanding of how often the plan is being used, how quickly it pays out, and what it compares in the payout scale to other plans, you’ll be in a better position to make an informed decision about keeping or dropping that insurance plan.